Subsections of Visual Studio
Installing Visual Studio
Installing Visual Studio
Visual Studio Community 2022 is available on the machines we use
for CIS 300 labs, as well as on machines in other lab classrooms. Students can also access Visual Studio via a remote desktop server — see the CS Department Support
Wiki
for details. This edition of Visual Studio is also freely available for installation on your own PC for your personal and classroom use. This section provides instructions for obtaining this software
from Microsoft and installing
it on your PC.
While Microsoft also produces a version of Visual Studio for Mac, we recommend the Windows version. If you don’t have a Microsoft operating system, you can
obtain one for free from the Azure Portal — see the CS Department Support Wiki
for details. You will need to install
the operating system either on a separate bootable partition or using
an emulator such as VMware Fusion. VMware Fusion is also available for
free through the VMware Academic Program — see the CS Department
Support Wiki
for
details.
To download Visual Studio Community 2022, go to Microsoft’s Visual Studio Site
, and from the “Download Visual Studio” dropdown, select “Community 2022”. This should normally begin downloading an installation file; if not, click the “click here to retry” link near the top of the page. When the download has completed, run the
file you downloaded. This will start the installation process.
As the installation is beginning, you will be shown a window
asking for the components to be installed. Click the “Workloads” tab
in this window, and select “.NET desktop development” (under “Desktop
& Mobile”). You can select other workloads or components if you wish,
but this workload will install all you need for CIS 300.
The first time you run Visual Studio, you will be asked to sign in to
your Microsoft account. You can either do this or skip it by clicking,
“Not now, maybe later.” You will
then be shown a window resembling the following:
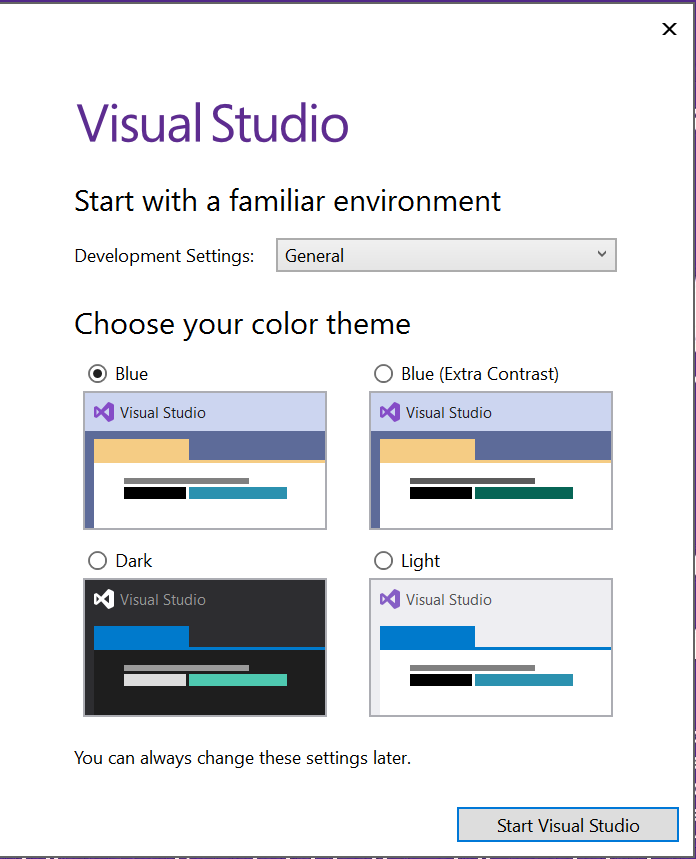
Next to “Development Settings:”, select “Visual C#”. You can select
whichever color scheme you prefer. At this point, Visual Studio should be fully installed and ready to
use.
Git Repositories
Git Repositories
In CIS 300, start code for each assignment will be distributed via a Git repository. Git is a source control system integrated into Visual Studio 2022. Source control systems are powerful mechanisms for teams of programmers and other collaborators to manage multiple copies of various source files and other documents that all collaborators may be modifying. While CIS 300 does not involve teamwork, source control provides a convenient mechanism for distribution of code and submission of assignment solutions. In addition, as we will discuss later, source control provides mechanisms for accessing your code on multiple machines
and for “checkpointing” your code
.
At the heart of Git is the concept of a Git repository. A Git
repository is essentially a folder on your local machine. As you make
changes within this folder, Git tracks these changes. From time to
time, you will commit these changes. If you see that you have gone
down a wrong path, you can revert to an earlier commit. Git
repositories may be hosted on a server such as GitHub. Various users
may have copies of a Git repository on their own local machines. Git
provides tools for synchronizing local repositories with the
repository hosted on the server in a consistent way.
Note
The above description is a bit of an oversimplification, as the folder
comprising a local copy of a repository typically contains some files
and/or folders that are not part of the repository. One example of
such “extra” files might be
executables that are generated whenever source code within the
repository is compiled. However, when Visual Studio is managing a Git
repository, it does a good job of including within the repository any
files the user
places within the folder comprising the repository.
For each lab and homework assignment in CIS 300, you will be provided a URL that will create your own private Git repository on GitHub. The only people who will have access to your GitHub repositories are you, the CIS 300 instructors, and the CIS 300 lab assistants. These repositories will initially contain start code and perhaps data files for the respective assignments. You will copy the repository to your local machine by cloning it. When you are finished with the assignment, you will push the repository back to GitHub and submit its URL for grading. In what follows, we will explain how to create and clone a GitHub repository. Later in this chapter, we will explain how to commit changes, push a repository, and use some of the other features of Git.
Before you can access GitHub, you will need a GitHub account. If you don’t already have one, you can sign up for one at github.com
. At some point after you have completed the sign-up process, GitHub will send you an email asking you to verify the email address you provided during the sign-up process. After you have done this, you will be able to set up GitHub repositories.
For each assignment in CIS 300, you will be given an invitation URL, such as:
Over the next few sections, we will be working through a simple example based on the above invitation link. If you wish to work through this example, click on the above link. You may be asked to sign in to GitHub, but once you are signed in, you will be shown a page asking you to accept the assignment. Clicking the “Accept this assignment” button will create a GitHub repository for you. You will be given a link that will take you to that repository. From that page you will be able to view all of the files in the repository.
In order to be able to use this repository, you will need to clone it
to your local machine. To do this, first open Visual Studio 2022, and
click on the “Clone a Repository” button on the right. In your web
browser, navigate to the GitHub repository that you wish to clone, and
click on the “Code” button. This will display a URL - click on the
button to its right to copy this URL to your clipboard. Then go back
to Visual Studio and paste this URL into the text
box labeled, “Repository location”. In the text box below that, fill
in a new folder you want to use for this repository on your machine,
then click the “Clone” button (if you are asked to sign in to GitHub, click the link to sign in through your web browser). This will copy the Git repository from
GitHub into the folder you selected, and open the solution it contains.
The following sections give an overview of how to use Visual Studio to edit and debug an application, as well as how to use Git within Visual Studio to maintain the local Git repository and synchronize it with the GitHub repository.
Visual Studio Solutions
Visual Studio Solutions
All code developed within Visual Studio 2022 must belong to one or more solutions. When you are using Visual Studio to develop a program, you will be working with a single solution. A solution will contain one or more projects. Each of these projects may belong to more than one solution. Each project typically contains several files, including source code files. Each file will typically belong to only one project. The following figure illustrates some of the possible relationships between solutions, projects, and files.
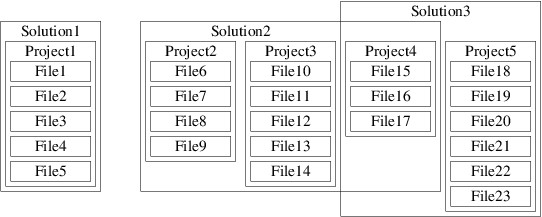
Note that in the above figure, Project4 is contained in both Solution2 and Solution3. In this section, we will focus on solutions that contain exactly one project, which in turn belongs to no other solutions (e.g., Solution1 in the above figure).
Whenever you open a solution in Studio 2022, the Solution Explorer
(which you can always find on the “View” menu) will give you a view of
the structure of your solution; for example, opening the solution in
the repository given in the previous section
may result in the
following being shown in the Solution Explorer:
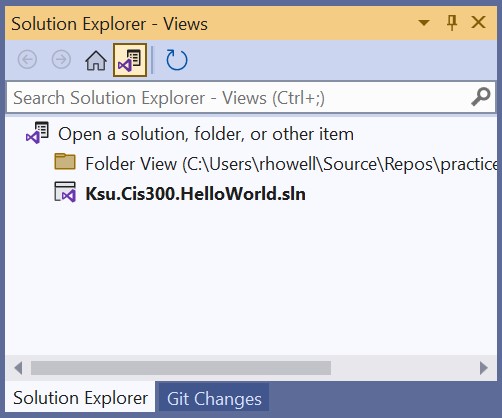
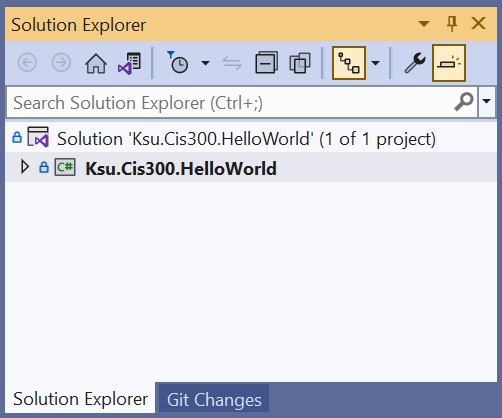
If you see the above, you will need to change to the Solution view, which you can get by double clicking the line that ends in “.sln”. This will give you the following view:
Warning
You ordinarily will not want to use Folder view, as this will cause files to be edited without any syntax or consistency checking. As a result, you can end up with a solution that is unusable. If your Solution Explorer ever looks like this:
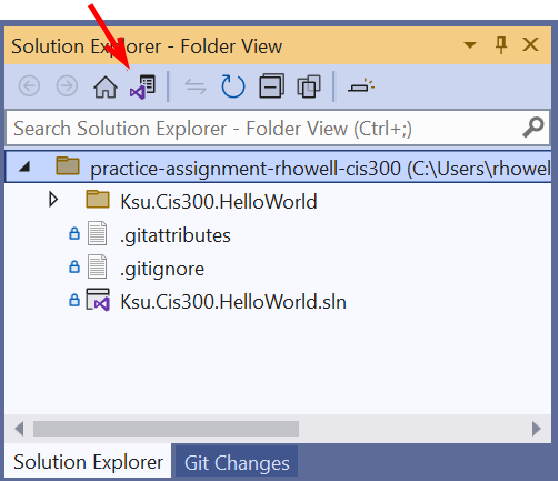
(note the indication “Folder View” at the top and the absence of any boldface line), then it is in Folder view. To return to Solution view, click the icon indicated by the arrow in the above figure. This will return the Solution Explorer to the initial view shown above, where you can double-click the solution to select Solution view.
If you click on the small triangle to the left of
“Ksu.Cis300.HelloWorld”, you will get a more-detailed view:
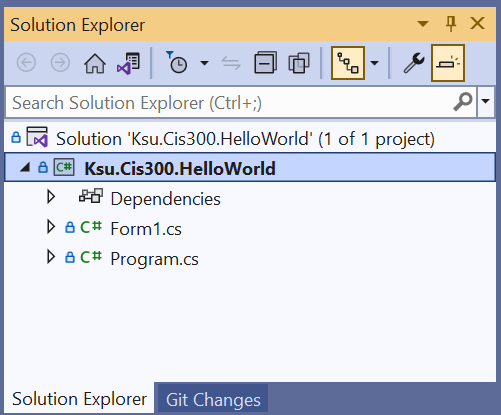
Near the top, just under the search box, is the name of the solution with an indication of how many projects it contains. Listed under the name of the solution is each project, together with the various components of the project. One of the projects is always shown in bold face. The bold face indicates that this project is the startup project; i.e., it is the project that the debugger will attempt to execute whenever it is invoked (for more details, see the section, “The Debugger”
).
The project components having a suffix of “.cs” are C# source code files. When a Windows Forms App is created, its project will contain the following three source code files:
-
Form1.cs: This file contains code that you will write in order to implement the main GUI for the application. It will be discussed in more detail in “The Code Window”
.
-
Form1.Designer.cs: You will need to click the triangle to the
left of “Form1.cs” in the Solution Explorer in order to reveal this
file name. This contains automatically-generated code that completes
the definition of the main GUI. You will build this code indirectly
by laying out the graphical components of the GUI in the design window (see the section, “The Design Window”
for more details). Ordinarily, you will not need to look at the contents of this file.
-
Program.cs: This file will contain something like the following:
namespace Ksu.Cis300.HelloWorld
{
    internal static class Program
    {
        /// <summary>
        ///  The main entry point for the application.
        /// </summary>
        [STAThread]
        static void Main()
        {
            // To customize application configuration such as set high DPI settings or default font,
            // see https://aka.ms/applicationconfiguration.
            ApplicationConfiguration.Initialize();
            Application.Run(new Form1());
        }
    }
}
The Main method is where the application code begins. The last line of this method constructs a new instance of the class that implements the GUI. The call to Application.Run
displays the GUI and starts a loop that processes events such as mouse clicks and keystrokes. Ordinarily, there is no need to look at this code.
One of the first things you will need to do when starting a new Windows Forms App is to change the name of Form1.cs, as this name (without the “.cs” suffix) is also the name of the class implementing the GUI. Therefore, it will need to be changed in order to conform to the naming convention
for classes. To do this, right-click on its name in the Solution Explorer, and select “Rename” from the resulting popup menu. You will then be able to edit the name in the Solution Explorer - change it to “UserInterface.cs”. When you have entered the new name, the following window will be displayed:
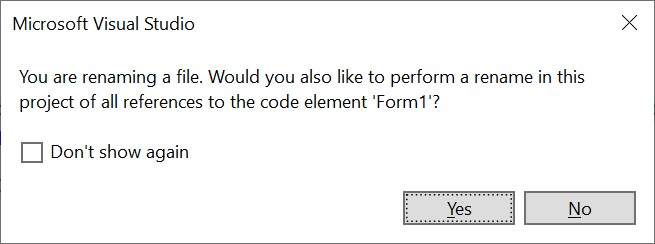
You should click the “Yes” button in order to make the renaming consistent - particularly to rename the class as well.
The Design Window
The Design Window
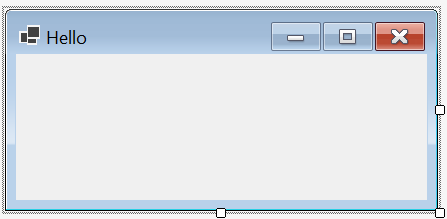
The Design Window in Visual Studio is a window used to build graphical components. To open the Design Window for a graphical component, double-click on the component’s file name in the Solution Explorer. If you are working through the example from the previous two sections, double-click “UserInterface.cs” to open its Design Window. It will initially contain a blank form:
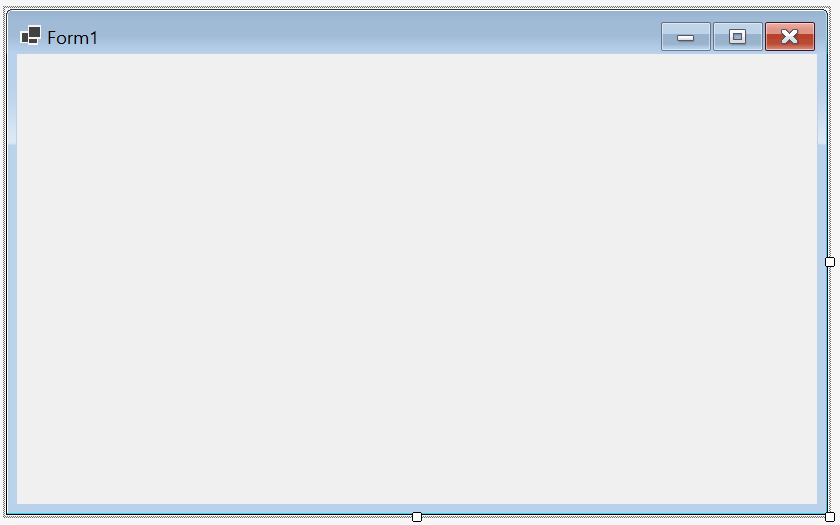
You can resize the form by dragging the handles on the right and
bottom edges. You can also change the title of the form (“Form1” in the picture above) as follows:
-
Click on the form.
-
If the Properties window isn’t showing on the right, select “Properties Window” from the “View” menu.
-
Look at the row of buttons near the top of the properties window,
and make sure the second and third buttons are highlighted:
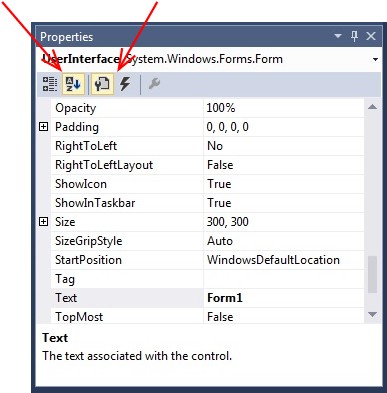
If either of these buttons isn’t highlighted, click it to
highlight it. The first two buttons on this row toggle whether the
information is arranged by category (the first button) or
alphabetically (the second button). The next two buttons toggle
whether the control’s properties (the third button) or events (the
fourth button — we’ll discuss these below) are shown.
-
Find “Text” in the left column of the Properties window - it will
probably be highlighted. Click on the space to its right, and edit
the text to give your desired title. If you are working through
the example, give it a title of “Hello”.
For example, after resizing and changing the title, we might have a form that looks like this:
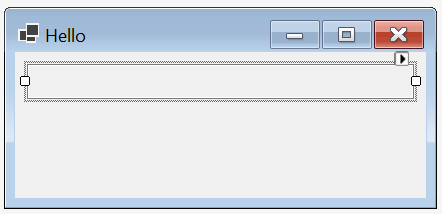
To add various graphical controls to the form, we use the Toolbox, which is normally available via a tab on the left edge (if not, you can always access it via the “View” menu). For example, let’s add a box that will contain text generated by the program. We open the Toolbox and click on the TextBox control, which can be found in the “Common Controls” section. We can then click on the design window (outside of the form) to bring it to the front, and drag an area on the form that we would like the TextBox to fill. After doing so, there will be a handle on the right and left edges to allow horizontal resizing (don’t worry about vertical resizing yet). You can also drag the TextBox to adjust its location. If you do this, as the edges of the TextBox approach the edges of the frame, struts will appear, helping you to leave an appropriate margin.
After adding a control, we usually need to customize it to some degree. To do this, click on it, then open the Properties window again. This window will now display the properties of the TextBox. The first property we will always want to change is the name of the variable that the program will use to refer to this control. This property is called “(Name)”, and will be near the top. You will need to change this name so that it follows the naming convention
for controls on forms.
There are various properties that can be changed to customize the
appearance and behavior of a control. For example, we can change the
font of a TextBox by changing its Font property. This in turn
will affect the height of the TextBox. We can prevent the user
from editing it by setting its ReadOnly property to True. If
we want to allow multiple lines, we can set its Multiline property
to True. This in turn will add handles to the top and bottom edges
so that we can adjust its height. All of the properties of a GUI
control are documented in that control’s API documentation within the
.NET API browser
.
Thus, continuing the above example, if we modify the TextBox’s variable name to uxDisplay, its Font property to Microsoft Sans Serif, 12pt and its ReadOnly property to True, we would have the following form:
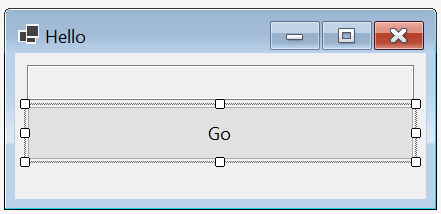
Using a similar process, we can now add a Button to the form and name it uxGo. To change the text in the Button, we will need to change its Text property. This might give us the following:
Now that we have a Button on our form, it would be appropriate to provide some functionality for that Button. Clicking on a Button signals an event to which our program may respond. In order to cause our program to respond to such an event, we need to provide an event handler for it. Because a click is the default event for a Button, we can create an event handler for this event by simply double-clicking on the Button. Doing so will open a code window containing the contents of the source code file defining the current form. Furthermore, if the name of the Button is uxGo, the following method will have been added:
private void uxGo_Click(object sender, EventArgs e)
{

}
This method will be called whenever the Button is clicked (code causing this behavior will have been automatically added to the file containing the automatically-generated code for the form). Thus, to provide the appropriate functionality for the Button we just need to add code providing this functionality to this method. We will discuss this in more detail in the next section
.
Before we leave the design window entirely, however, we need to talk about a more general way of accessing the event handlers associated with controls. Going back to the Properties window for a control, clicking the fourth button in the row of buttons near the top (the one that looks like a lightning bolt) will cause all of the possible events for that control to be displayed, and any event handler that has been created for that event. For example, if we have created the event handler described above, then the list of events for the Button looks like this:
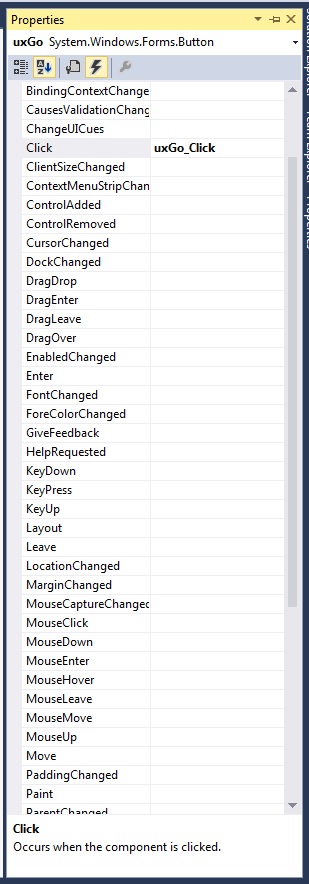
This list is useful for two reasons. The more obvious reason is that we sometimes might want to handle an event that is not the default event for a control. For example, we might want a Button to react in some way (perhaps by changing color, for example) whenever the mouse enters or leaves it. In order to implement this functionality, we would need event handlers for the MouseEnter and MouseLeave events. We can add these event handlers by double-clicking these events in this list.
The less obvious use for this list is to remove an event handler. Often we find that we have added an event handler that we don’t need, perhaps by double-clicking in the wrong place. When this happens, shouldn’t just delete the code, because there is other automatically-generated code that refers to it. Deleting the code for an event handler would therefore lead to a syntax error. Instead, the proper way to remove an event handler is to go to the list of events, right-click on the name of the event, and select “Reset” from the resulting popup menu. This safely deletes the code and all automatically-generated references to it. (Sometimes it doesn’t delete the code, but if not, it is now safe to delete it.)
The Code Window
The Code Window
In the previous section
, we designed the following GUI:

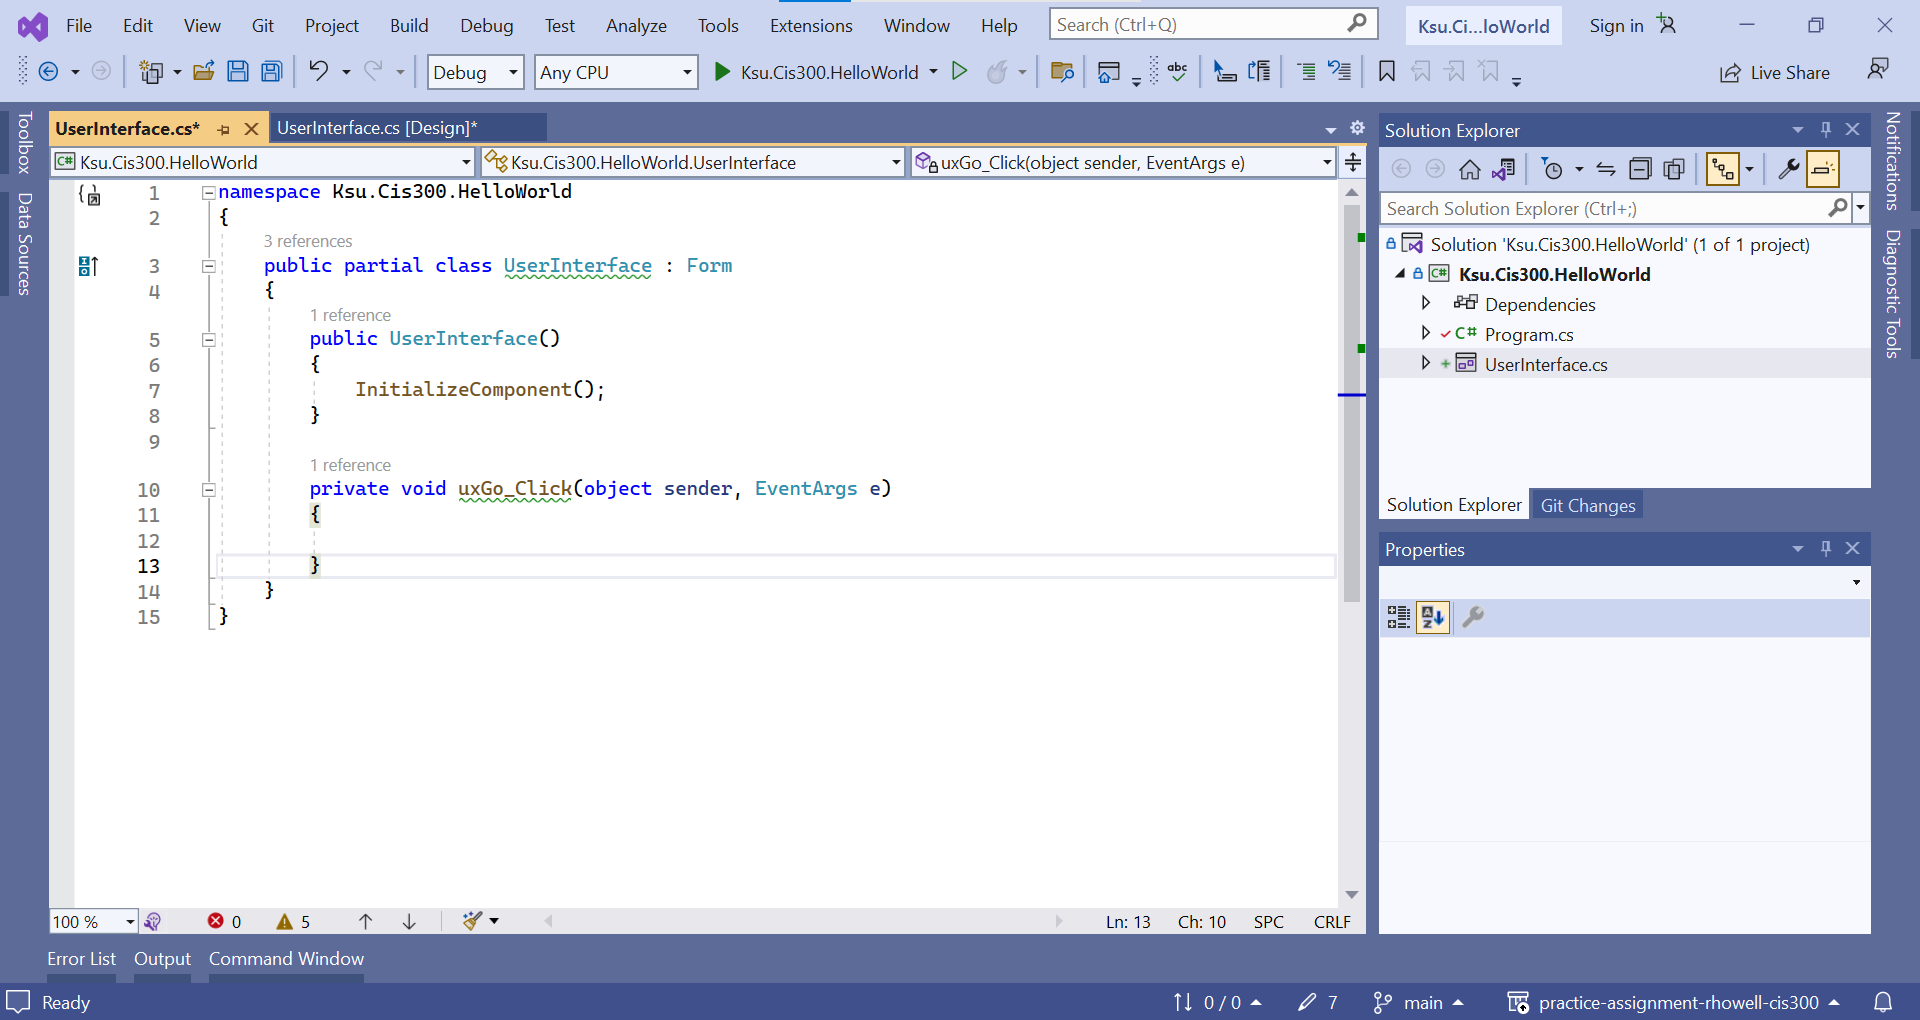
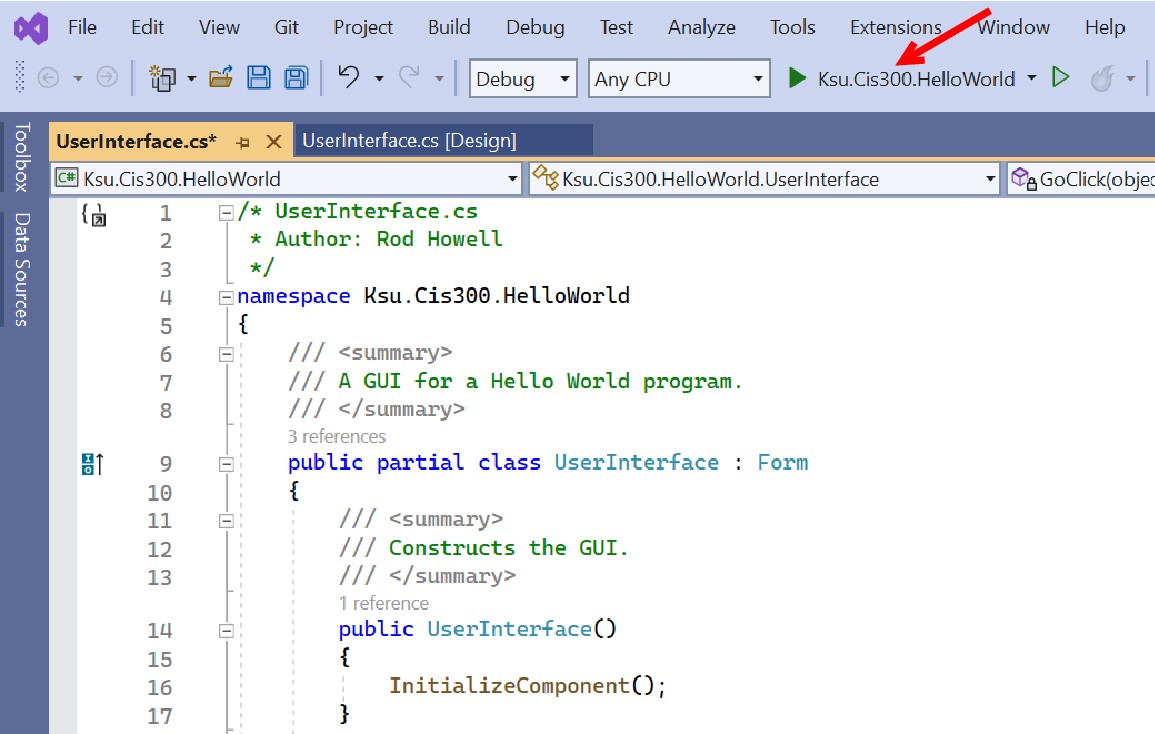
We also indicated briefly how functionality could be added to the button by double-clicking it in the design window to create an event handler. Creating this event handler also opens the code window to display it. The code window for this file can also be displayed by pressing F7 in the design window or by right-clicking the source code file name in the Solution Explorer and selecting “View Code”. Once a code window has been opened, it can be brought to the front by clicking the tab containing its file name near the top of the Visual Studio window. This window should look something like this:
Here is a ZIP archive containing the entire Visual Studio
solution
. After downloading and expanding it, you may need to navigate through a folder or two, but you should be able to find a file, Ksu.Cis300.HelloWorld.sln (the “.sln” suffix may not be visible, but it should show as type “Microsoft Visual Studio Solution”). If you double-click on this file, Visual Studio 2022 should open the solution (if you have an older version of Visual Studio on your machine, you may need to right-click the file and select “Open with -> Microsoft Visual Studio 2022”).
Note in the class statement the keyword, partial. This indicates that not all of this class definition is in this file. The remainder of the definition is in the file, UserInterface.Design.cs. Recall that this file contains code for laying out the GUI and making the uxGo_Click method an event handler for the “Go” button. One of the method definitions that it contains is the InitializeComponent method, which does the layout of the GUI and sets up the event handlers. Recall also that the Main method in Program.cs constructs an instance of this class, then displays it and begins processing events for it. Because the constructor (see the code window above) calls the InitializeComponent method, everything will be set up to run the application - all that is needed is code for the event handler. This code will then be executed every time the “Go” button is clicked.
Before we add code to the event handler, let’s first take care of a couple of other issues. Note that in the code window shown above, lines 3 and 10 contain code underlined in green. These underlines indicate compiler warnings. While code containing warnings will execute, one of the requirements of CIS 300 is that all code submitted for grading be free of warnings (see Programming Style Requirements
).
We can see each warning by hovering the mouse over the underlined code. For example, hovering over “UserInterface” in line 3 displays the following:
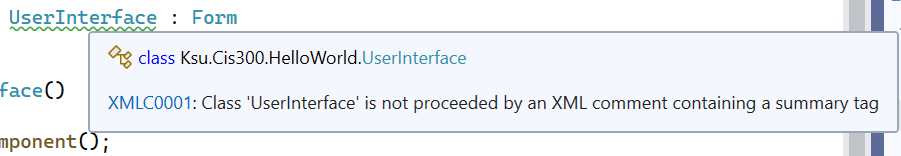
This warning refers to the CIS 300 style requirement that each class, structure, enumeration, field, property, and method be preceded by an appropriate comment (see Comments
). To remove this warning, insert a new line prior to line 3, and type /// on this new line. This will cause an XML comment to be inserted:
/// <summary>
///
/// </summary>
public partial class UserInterface : Form
This is not quite enough to remove the warning. To accomplish this, text must be entered between <summary> and </summary>. Any non-blank text will remove the warning, but in order for the comment to be useful, the text should summarize the purpose of the class; for example,
/// <summary>
/// A GUI for a Hello World program.
/// </summary>
public partial class UserInterface : Form
Line 10 actually contains four warnings. Three of them can be removed by adding an appropriate comment, including descriptions of the two parameters (all event handlers in CIS 300 will have similar parameter lists, though the type of the second parameter will vary depending on the type of event that is being handled):
/// <summary>
/// Handles a Click event on the "Go" button.
/// </summary>
/// <param name="sender">The object signaling the event.</param>
/// <param name="e">Information about the event.</param>
private void uxGo_Click(object sender, EventArgs e)
These, comments, however, do not take care of the last warning, which states that uxGo_Click is not in Pascal case. This refers to the naming convention
for methods. To fix this warning, we need to rename this event handler by removing ux and _.
Warning
Care must be taken when renaming an identifier, as all occurrences of the identifier need to be changed. In this case, some occurrences of this name are in the automatically-generated code in UserInterface.Designer.cs. Because the Design window relies on this code, failing to change these occurrences will cause the Design window to fail to open due to syntax errors in this file.
The safe way to change any identifier name within Visual Studio is to use its Rename feature. First, right-click on the name to be changed, and select “Rename…” from the resulting popup menu. This will open a dialog within which the name can be changed. Once the name is changed, press Enter to cause the identifier to be renamed globally.
All warnings should now be gone. However, the CIS 300 style requirements specify two other comments that need to be added (see Comments
). First, an XML comment needs to be added to the constructor. Second, a comment containing the file name and the author’s name needs to be inserted at the top of the file, after inserting these comments, your code should resemble the following (with “Rod Howell” replaced by your name):
/* UserInterface.cs
 * Author: Rod Howell
 */
namespace Ksu.Cis300.HelloWorld
{
    /// <summary>
    /// A GUI for a Hello World program.
    /// </summary>
    public partial class UserInterface : Form
    {
        /// <summary>
        /// Constructs the GUI.
        /// </summary>
        public UserInterface()
        {
            InitializeComponent();
        }

        /// <summary>
        /// Handles a Click event on the "Go" button.
        /// </summary>
        /// <param name="sender">The object signaling the event.</param>
        /// <param name="e">Information about the event.</param>
        private void GoClick(object sender, EventArgs e)
        {

        }
    }
}
Now we can finally turn our attention to providing functionality to the “Go” button; i.e., we will add code to the GoClick event handler. In order for this code to provide meaningful functionality, it will need to interact with the controls on the GUI. It needs to use their variable names to do this. The name of the TextBox in this code is uxDisplay (recall that you can find this variable name by opening the design window
, clicking on the control, and finding its “(Name)” property in its Properties window). Suppose we want to respond to the event by placing the text, “Hello world!”, in this TextBox. We therefore need to change its Text
property
to contain this string; i.e.:
private void GoClick(object sender, EventArgs e)
{
    uxDisplay.Text = "Hello world!";
}
Notice that when you type a quote mark, a matching quote is automatically added following the text cursor. As long as you don’t reposition the text cursor, you can just type the closing quote as you normally would after typing the text string — Visual Studio won’t insert another quote mark, but will move the text cursor past the one it inserted automatically. The same behavior occurs when you type open parentheses, brackets, or braces.
The code window has several features that help with code writing. One of these features is auto-completion. Often while you are typing code, an auto-complete list appears, often with an entry highlighted. When an entry is highlighted (either automatically or by your selecting it manually), pressing “Enter” or typing a code element that can’t be part of the name (such as “.” or “+”) will insert the completion into your code. Once you get used to this feature, it can greatly speed up your code entry. Furthermore, it can be a helpful reminder of what you might need to type next. If you don’t want a name to auto-complete (perhaps because it is a name you haven’t defined yet), you can press “Esc”, and the auto-complete list will disappear.
Warning
If you are not using a lab machine, you might notice that as you type text, Visual Studio often provides auto-completions for the entire line. In some cases, the auto-completion is what you need, but in other cases, it is not. This feature can speed up the code-writing process for experienced programmers who use an auto-completion when they see that it matches what they were going to type. For inexperienced programmers, however, it can actually slow both the coding process and the learning process by making bad suggestions. If you find yourself using the auto-complete suggestions as hints, it would make sense to disable them, as these “hints” are often misleading. To disable this feature:
- From the “Tools” menu, select “Options…”.
- From the list on the left, select “IntelliCode”.
- In the large box in the upper-right, uncheck “Show whole line completions”.
- Save any changes, and restart Visual Studio.
This feature has been disabled on the lab machines.
Another feature of the code window is parameter information that shows as a popup box when you are typing a parameter list in a method call; for example:
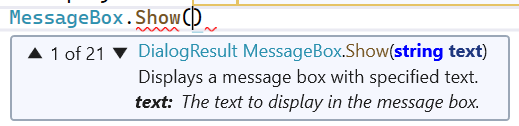
This popup box gives the return type of the method, followed by the name of the method, followed by the parameter list, with the type of each parameter shown and the current parameter in bold face. When there are more than one method with the same name, this is indicated in the upper-left corner of the popup box (“1 of 21” in the figure above — the method shown is the first of 21 methods having that name). You can use either the arrows in the popup box or the up and down arrows on the keyboard to scroll through these different methods.
A related feature allows certain information to be obtained by hovering the mouse over different code elements. For example, hovering the mouse over an identifier will display the declaration and documentation for that identifier in a popup box. Also, hovering the mouse over a syntax error (indicated by a red underline, as shown under “Show” in the above figure) will display an explanation of the error, in addition to any information on the code element.
The Debugger
The Debugger
In previous sections, we discussed how a Windows Forms Application can be built using Visual Studio. Having built an application, we need to be able to run and test it. To do this, we use the Visual Studio Debugger. When an application is loaded into Visual Studio, we can invoke the debugger by clicking the “Start Debugging” button near the top:
When the debugger starts, it attempts to do the following things:
- Save any unsaved files.
- Compile the source code into executable code.
- Run the compiled code as an application.
If everything works correctly, the application is complete. Rarely, however, does everything work correctly the first time. Through the remainder of this section, we will discuss some of the ways the debugger can be used to find and fix errors.
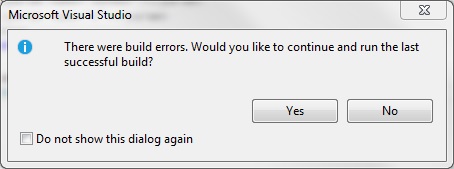
One of the problems that can occur is that the compiler can fail to produce executable code because the source code contains syntax errors. When this happens, the following dialog is displayed:
Usually the best thing to do at this point is to click the “No” button. This will stop the debugger and display the error list. This error list can be displayed at any time by clicking the error list button at the bottom of the Visual Studio window:
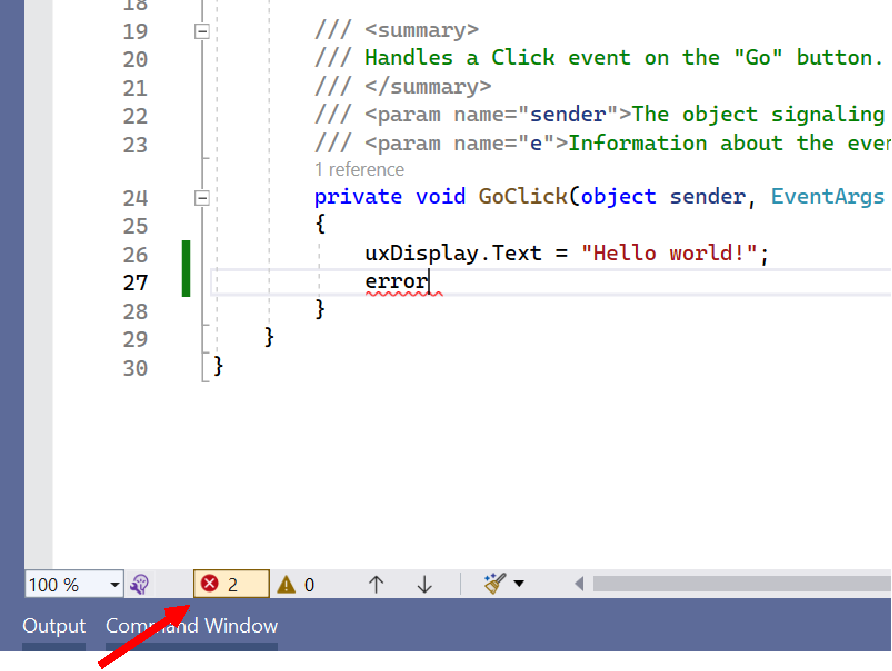
Double-clicking on a syntax error within the error list will highlight the error in the code window. Normally, fixing the error will cause the corresponding entry in the error list to disappear; however, there are times when the entry won’t disappear until the debugger is started again (i.e., by clicking the “Start Debugging” button).
Once the syntax errors are removed, the debugger will be able to generate executable code and run it. However, more problems can occur at this point. One common problem is that an exception is thrown. For example, the GitHub repository created by this invitation link
(see “Git Repositories
”) contains a Visual Studio solution for a program to convert decimal numbers to base-16. Don’t worry about understanding the code, although the numerous comments may help you to do that. Instead, note that an exception is thrown when we try to convert 256:
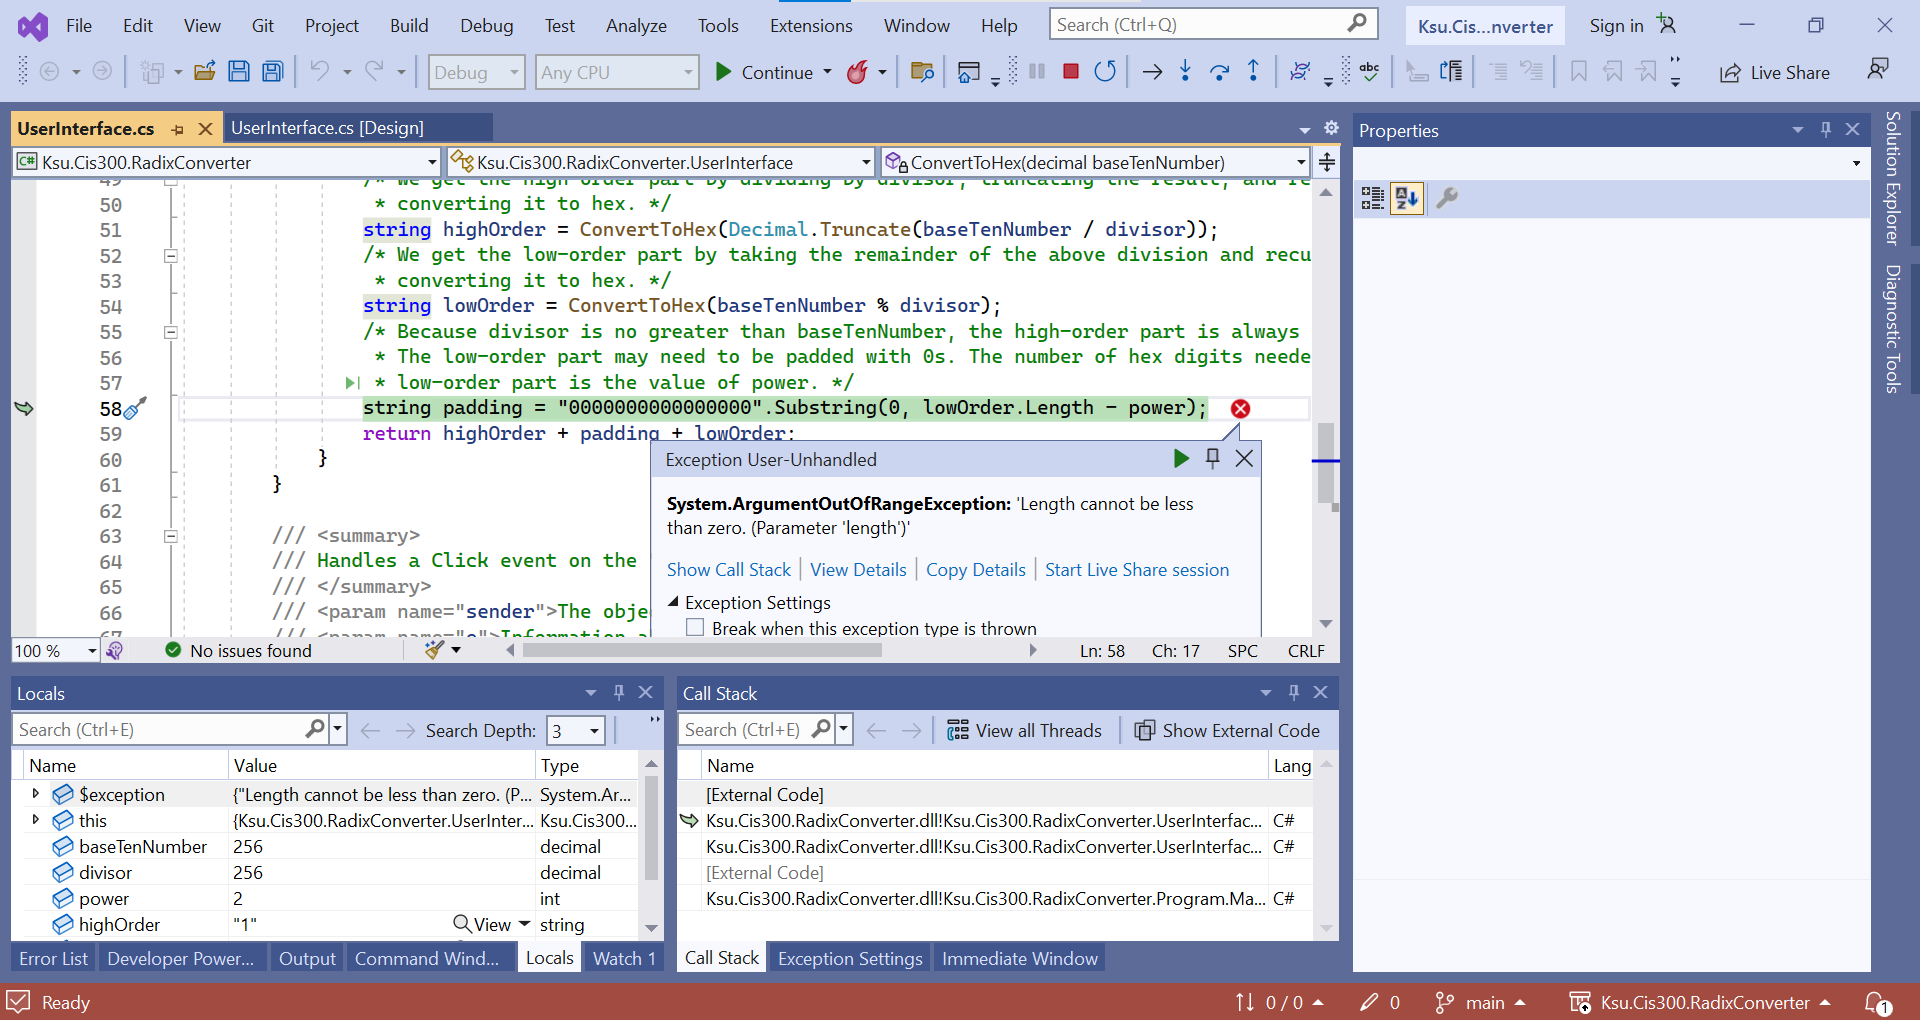
This message gives us quite a bit of information already. First, it tells us which line threw the exception - the line highlighted in green. The arrow in the left margin tells us the same thing, but more generally, when the debugger is running, it indicates the line that is currently being executed or that is ready to be executed. The popup window indicates what kind of exception was thrown: an ArgumentOutOfRangeException. It also provides the additional information that a length was less than zero when it should not have been.
Having this information, we can now use the debugger to investigate further the cause of the exception. First, in order to see the code more clearly, we might want to close the popup window (we can always get it back by clicking the red circle containing the white ‘X’). We can now examine the values of any of the variables at the time the exception was thrown by hovering the mouse over them. For example, if we hover over lowOrder, a popup appears indicating that it has a value of “0”. If we move the mouse to hover over its Length property, we can see that it has a value of 1. Hovering over power shows that it has a value of 2. Thus, we can see that the exception was thrown because we gave the Substring method a length of 1 - 2 = -1. This can be confirmed by hovering the mouse over the “-” in the expression - the popup indicates that the value of the expression is, in fact, -1.
Actually fixing the error requires a little more understanding of the code. In this case, however, the comment immediately above the line in question helps us out. It tells us that the low-order part of the hex string we are building may need to be padded with 0s - this padding is what we are constructing. Furthermore, it tells us that the number of hex digits we need is the value of power. In order to get this many digits, we need to subtract the number of hex digits we already have in lowOrder from power; i.e., we need to reverse the order of the subtraction.
To stop the debugger, notice the buttons that are available at the top of the Visual Studio window while the debugger is running:
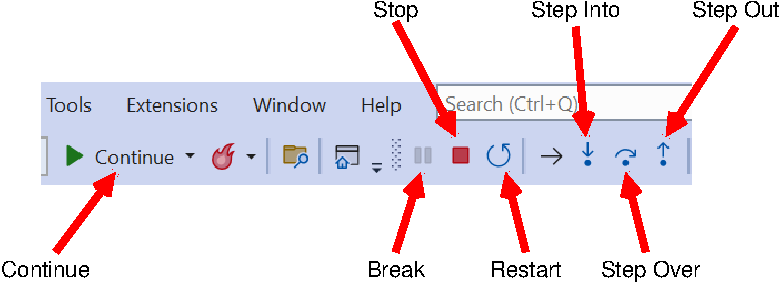
As you might guess, the “Stop” button stops the debugger. In what follows, we will discuss each of the other buttons indicated in the above figure, as well as other features of the debugger.
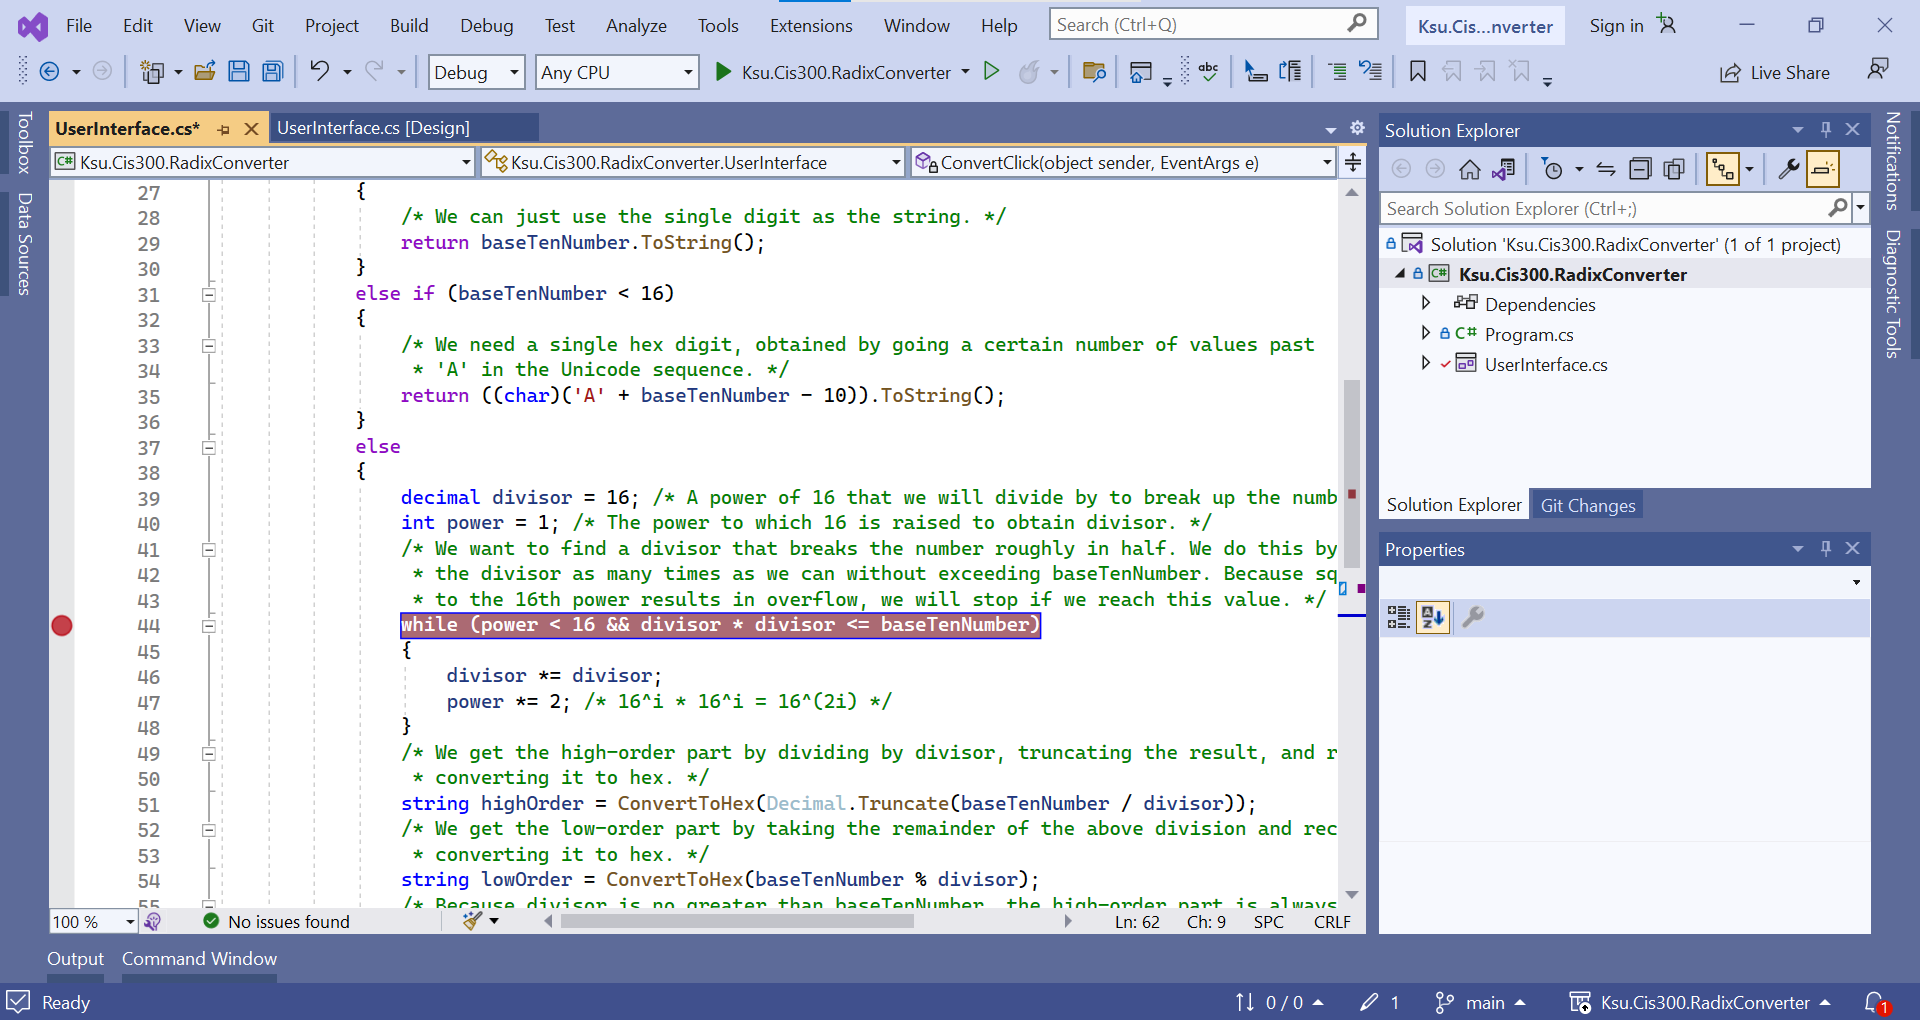
When debugging code, it is often useful to be able to pause execution at a particular place in order to be able to examine the values of variables as we did above. To accomplish this, we can set a breakpoint by clicking in the left margin of the code window at the line where we would like execution to pause. This places a large red dot in the margin where we clicked and colors the line red:
Whenever execution reaches a breakpoint, execution stops prior to executing that line. At this point, we can examine the values of variables as we described above. When we are ready to continue execution of the program, we click the “Continue” button. A breakpoint can be deleted by clicking on the red dot, or all breakpoints may be deleted by selecting “Delete All Breakpoints” from the “Debug” menu. A breakpoint may be disabled, but not deleted, by hovering over the large red dot and selecting “Disable” from the resulting popup. All breakpoints may be disabled by selecting “Disable All Breakpoints” from the “Debug” menu.
Sometimes we only want the execution to pause at a breakpoint when a certain condition is met. Such a situation might occur if we have a bug that only surfaces after the code containing it has already executed many times. Rather than letting the program stop and clicking “Continue” until we reach the point we are interested in, we can instead specify a condition on the breakpoint. To do this, right-click on the breakpoint in the left margin, and select “Conditions…” from the resulting popup menu. This causes a large box to be inserted into to the code below this line:
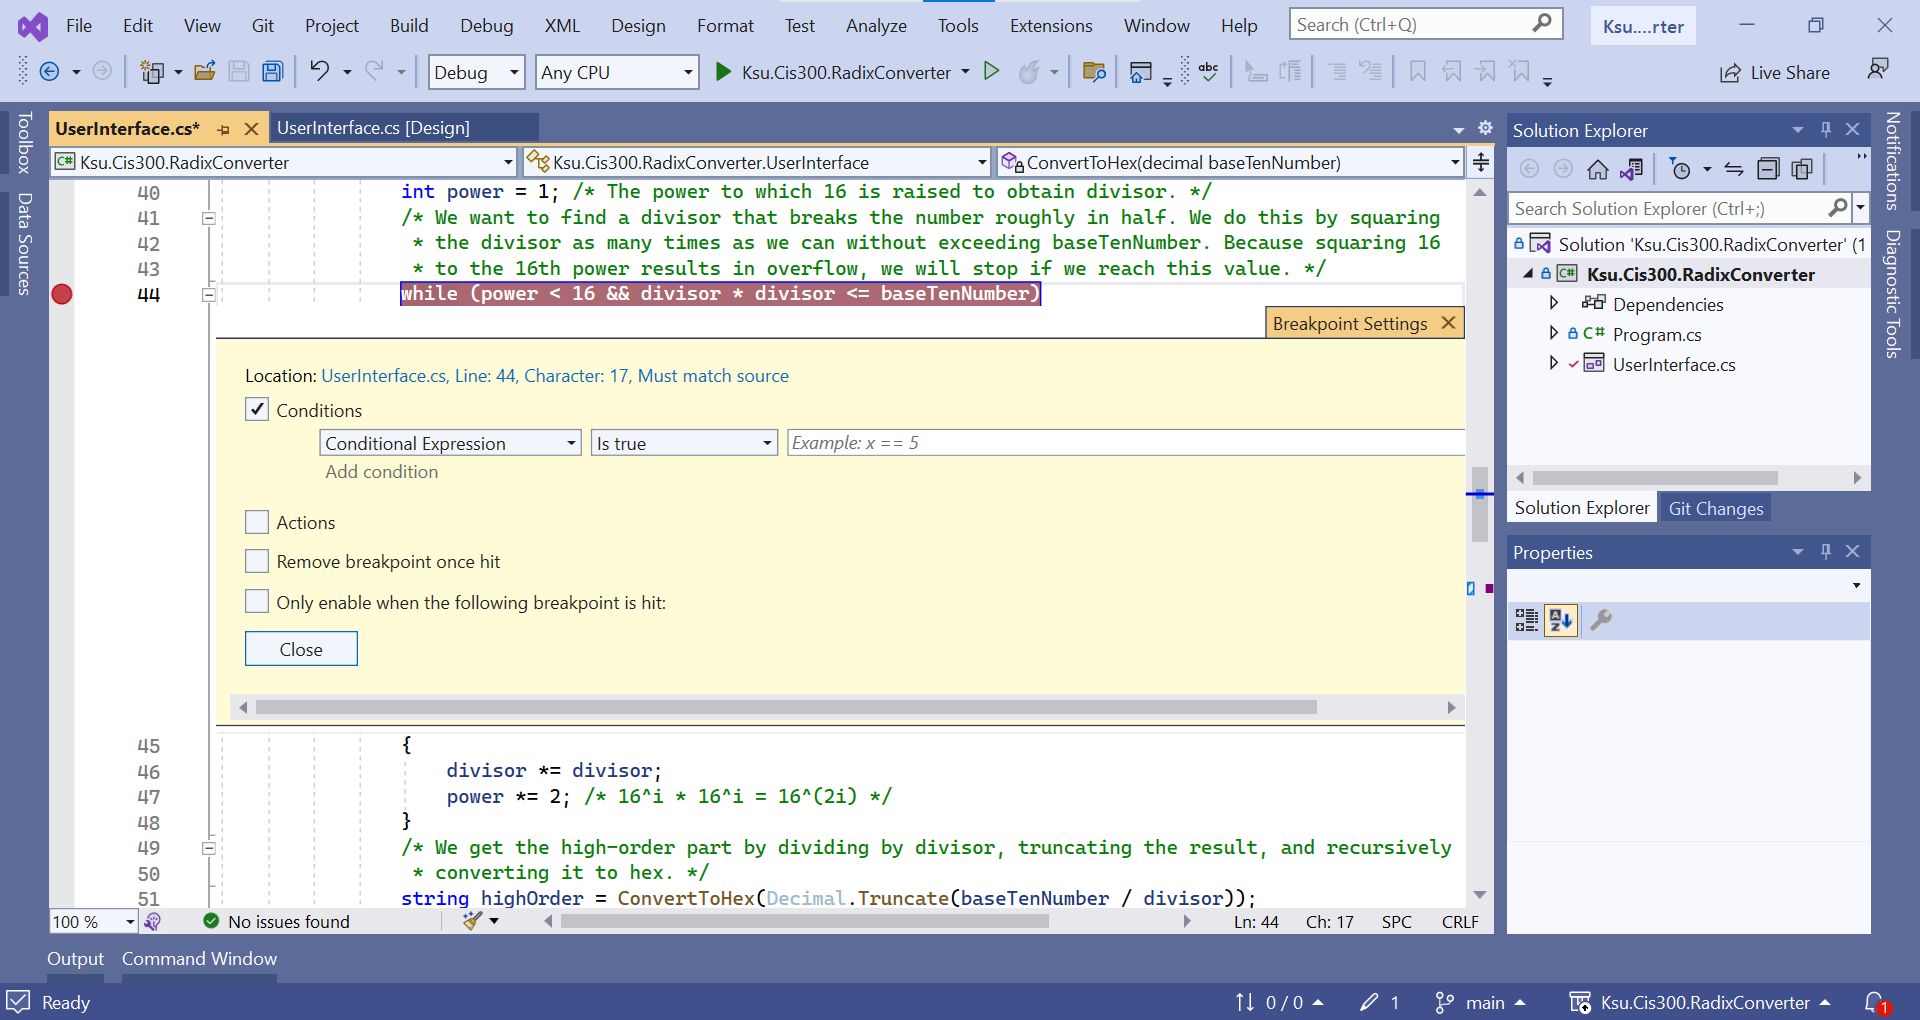
In this box, we can type an expression using variables visible at that program location. We can also choose whether we want execution to pause when that expression is true or whenever that expression has changed.
For example, we could add to the above breakpoint the condition:
Then when we run the debugger, execution will only pause at this breakpoint when power reaches a value of 8. Note that this line is executed at the top of each iteration of the loop; hence, the breakpoint condition is checked on each iteration.
While hovering the mouse over variable names is a useful way to
discover their current values, there are other mechanisms for doing
this as well. For example, while the debugger is paused, you can go to
the “Debug” menu and select “Windows -> Locals”. This will open a window displaying all of the local variables for the current method, property, or constructor, together with their current values. If the debugger is paused within a constructor or a non-static method or property, this window also contains this, which refers to the object that contains the constructor, method, or property. From this, you can access the non-static fields of this object.
Another mechanism for examining values of variables is through the “Immediate” window, which can also be accessed from the “Debug” menu via its “Windows” sub-menu. Within the Immediate window, you may type an expression involving the variables that are currently visible, press “Enter”, and it will display the value of that expression. This can be particularly useful when you have a large data structure, and you need to know a particular element in that structure. For example, suppose array is a large int[ ], and suppose i is an int. Using the “Locals” window, it might be rather tedious to find the value of array[i]. Using the Immediate window, however, you can just type in
and it will display its value.
When debugging, it is often useful to be able to step through the
execution of a piece of code so that you can see exactly what it is
doing. Three buttons are available for this purpose: “Step Into”,
“Step Over”, and “Step Out”. Suppose we were to run the code in the
GitHub repository provided above with the (unconditional) breakpoint shown in the above picture, and suppose we were to enter the value, 12345. Execution will then pause at this breakpoint with divisor equal to 16 and power equal to 1. Clicking either the “Step Into” button or the “Step Over” button will cause the debugger to evaluate the loop condition and, because its value is true, advance to the “{” on the next line. We may continue to walk through the execution a step at a time using either of these buttons - as long as we are in this loop, they will have the same effect. If the Locals window is open, whenever a variable changes value, this value will be shown in red.
After one iteration, the loop will terminate, and execution will reach the line where highOrder is defined. At this point, the functionality of the “Step Into” and “Step Over” buttons becomes different because this line contains a method call. The “Step Over” button will cause execution to run normally through the method call, and pause again as soon as the method call returns (however, because this is a recursive call, if the breakpoint is still set, execution will pause when it reaches the breakpoint within the recursive call). Thus, we can see the net effect of this method call without having to walk through it a step at a time. On the other hand, we might want to step through it in order to see what it is doing. We can do this using the “Step Into” button. If at some point we want to finish executing the method we are in, but pause after it returns, we can click the “Step Out” button.
When stepping through code, a “Watch” window is often a convenient way
to keep track of the value of one or more specific variables and/or
expressions. You can open a Watch window from the “Debug” menu under
“Windows -> Watch” — the four choices here are four different Watch windows that you may use (perhaps for debugging different parts of your program). A Watch window combines some of the advantages of the Locals window and the Immediate window. If you type in a value or expression, it will appear in the “Name” column, and if it can be evaluated in the current context, its value will be displayed in the “Value” column. Furthermore the value will be updated as the debugger executes code. You may list several values or expressions in the same Watch window, and their values will all be tracked. To delete an entry from a Watch window, right-click on it and select “Delete Watch”.
Submitting Assignments
Submitting Assignments
To submit a lab or homework assignment in CIS 300, you will need to do the following steps:
-
Commit your changes to your local Git repository. You will do this through the “Git Changes” tab in Visual Studio (if you don’t see this tab, click the icon that looks like a pencil at the bottom of the
Visual Studio window). In the “Git Changes” tab, in the box that says “Enter a message <Required>”, type in a message to be
associated with the changes you are committing.
Warning
Do not check the “Amend” box. This causes the previous commit to be changed, rather than creating a new commit. If this commit is already on GitHub, you will be unable to push your amended commit.
Then click “Commit
All”. A message at the top of the “Git Changes” tab will indicate whether the commit was successful.
-
Push your committed changes to GitHub. Do this by clicking the
up-arrow icon at the top of the “Git Changes” tab. Note that only committed changes will be pushed. A message at the top of the “Git Changes” tab will indicate whether the push was successful.
-
Submit the URL of the commit you want graded using the submission
form provided in the assignment instructions. This requires the
following steps:
- Reload the GitHub repository for this assignment in your web
browser, and click on the link showing the number of commits
(this is in the top right corner of the list of files and
folders in the repository). This
will show a list of commits, beginning with the latest. To the
right of each commit is a button labeled “<>”. This button
links to a web page displaying the entire contents of that
commit. (It’s a good idea to check to see that all of your
source code files are present, in case something went wrong.)
The URL of this page will end in a 40-digit hexadecimal number
giving a digital fingerprint of the commit. Copy this entire URL to
the submission form at the bottom of the assignment.
- To complete your submission, click the “Submit Assignment”
button in the assignment submission form. The time at which
this button was clicked will be the official submission time
for your assignment.
Warning
It is important to do all three of these steps in this order. In
particular, if you make any changes between your last commit and the
push, these changes won’t be included in the submission. It is also important to include the correct URL.
Tip
You can double-check that all changes have been pushed by looking at
the numbers next to the up-down-arrows and pencil icons at the bottom of the
Visual Studio window. If all changes have been pushed, all numbers
should be 0.
Occasionally, problems can occur with the interface between Visual
Studio and GitHub. These problems can prevent your code from being
pushed to GitHub. While the problems can often be fixed, it is often
easier to bypass Visual Studio altogether, and use GitHub’s file
upload mechanism.
Warning
This is not the preferred assignment submission procedure because it
is less automated (and hence more error-prone), and it creates a
commit on GitHub that is not in your local git repository. However, it
can be used if the above procedure doesn’t work for you.
To use this alternative submission procedure, do the following steps:
-
If Visual Studio is running, exit this application, making sure all files are saved.
-
In your web browser, navigate to the repository for the assignment you are submitting. You should see a list of files and folders, including a file whose name ends with “.sln”.
-
In your Windows file browser, navigate to your project folder for this assignment. You should see the same list of files and folders as is shown in your web browser. (Depending on the settings for your local machine, you may not see file name suffixes such as “.sln” and “.gitignore”, and if you’ve added any projects that were not in the original repository, their folders may be shown in the file browser but not in the web browser.)
-
In your web browser, click the “Add file” button in the row of
buttons above the list of files and folders, and select
“Upload files” from the drop-down menu.
-
In your file browser, type Control-“A” to select all files and folders, and drag them to the web browser where it says, “Drag files here …”. The web browser should indicate a number of files being uploaded.
-
Near the bottom of the web browser window, in the text box below “Commit changes”, type a commit message, then click the “Commit changes” at the bottom. It may take a little while to process, but eventually you should see the repository again.
-
Make sure all of your “.cs” files are present in the GitHub repository, and that they contain the code you want. (If you have removed or renamed any files, the original files may still be in the repository; however, they shouldn’t be in the solution, and therefore shouldn’t interfere with the program’s execution.)
-
Submit the URL of this commit by following Step 3 of the assignment submission process given above.
Unit Testing
Unit Testing
Some of the lab assignments in CIS 300 use a technique called unit testing for testing the correctness of your code. Unit testing is an automated technique for testing individual public methods and properties using a pre-defined set of test cases. We will be using an open-source unit-testing framework called NUnit
.
An NUnit test suite is a separate project contained within the same solution as the project it is to test. The GitHub repositories for lab assignments that utilize unit testing will initially contain these projects, whose names will typically end with “.Tests”. You should not modify these test projects.
A test project will contain one or more classes having the attribute, [TestFixture]. These classes will contain the specific tests, each of which is a method with the attribute, [Test]. The name of the method will briefly describe the test, and a more detailed explanation will be provided in comments.
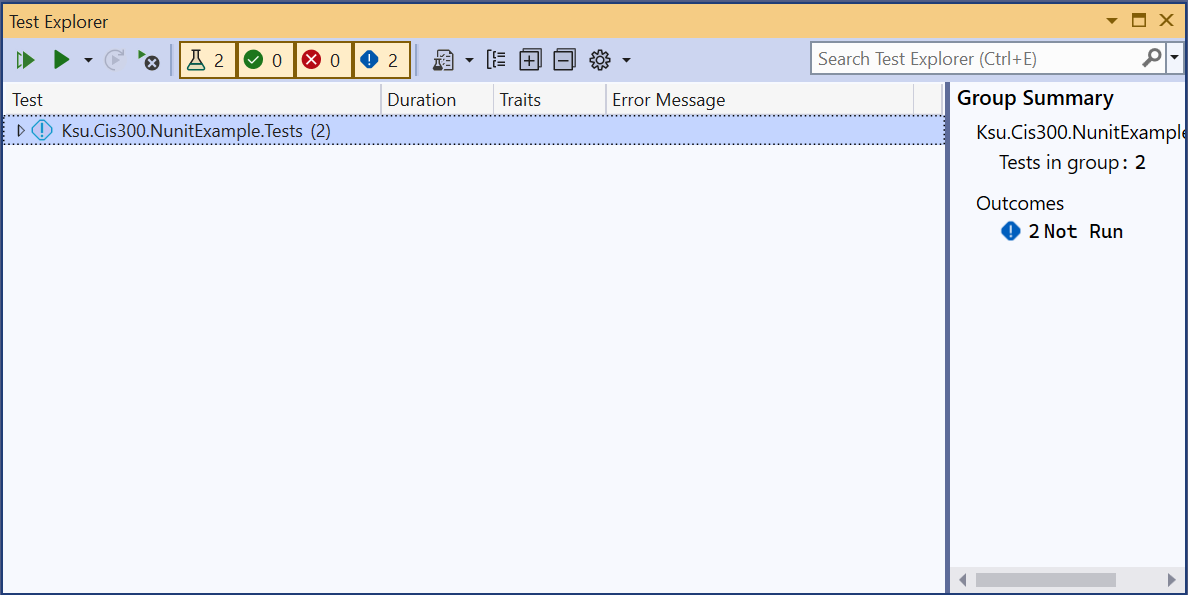
To run the tests, first go to the
“Test” menu and select “Test Explorer”. This will open the Test
Explorer, which should resemble the following:
Note
Depending on whether the test project has been successfully compiled, the tests in the large panel may or may not be shown.
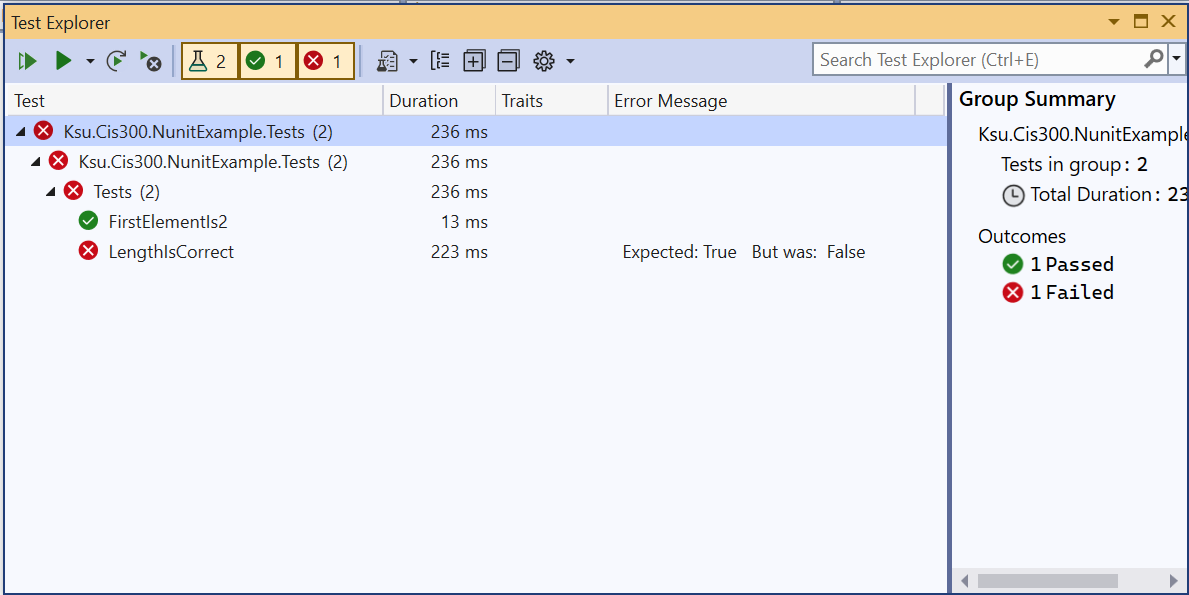
Then click the “Run All Tests in View” button in the upper-left corner of the Test Explorer. The Test Explorer should then show the results of all the tests:
Note
To see all of the output, you will need to open all of the elements either by
clicking on the small triangles to the left of each element or by clicking the icon containing the ‘+’ symbol.
The above output shows that there were two tests in the test suite. The names of the tests are simply the names of the methods comprising the tests. The output further shows that one of the tests, LengthIsCorrect, failed, whereas the other test, FirstElementIs2, passed.
The goal, of course, is to get all the tests to pass. When a test
fails, you will first want to refer to the comments on the test method
in order to understand what it is testing. Then by clicking on the
failed test in the Test Explorer, you can see exactly what failed in
the test - this will appear in the panel on the right. In some cases,
an unexpected result will have been produced. In such cases, the
message will show what result was expected, and what it actually
was. In other cases, an exception will have been thrown. In such
cases, the exception will be displayed. A stack trace will also be
displayed, so that you can tell what line of code threw the
exception. Finally, you can run the debugger on the test itself by
right-clicking on the test and selecting “Debug”. This will allow you
to debug your code using the techniques describe in the section, “The
Debugger”
.
Tip
You can dock the Team Explorer into the main Visual Studio window by
clicking on the small triangle in the far upper-right corner of the
window and selecting either “Dock” or “Dock as Tabbed Document”.
One potential error deserves special mention. Sometimes code will
throw an exception that cannot be caught by a try-catch block. By
far the most common of these exceptions is the
StackOverflowException. When this exception is thrown during unit
testing, the test explorer will simply show some or all of the tests
in gray letters. This indicates that these tests were not
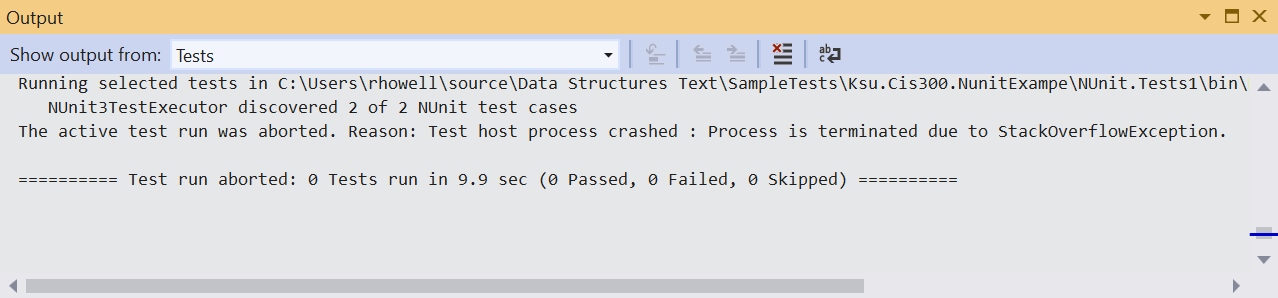
completed. To see why the tests were not completed, you can open the
“Output” window from the “View” menu and change the drop-down menu at the top to
“Tests”. This will indicate what error stopped the tests; for example,
the following indicates that a StackOverflowException has
occurred:
Unfortunately, when this error occurs, it’s more difficult to determine which test caused the exception. You can run the debugger on each test individually to see if it throws a StackOverflowException. In many cases, however, it is easier to examine each recursive call to make sure the call is made on a smaller problem instance.
When you believe you have fixed any errors in your code, you will
usually want to run all the tests again, as fixing one error can
sometimes introduce another. However, there are times, such as when
some of the tests are slow, when you don’t want to run all the
tests. In such cases, you can select an appropriate alternative from
the “Run” drop-down at the top of the Test Explorer (i.e., from the
drop-down button with the single green triangle on it). A useful option from this menu is “Run Failed Tests”. Alternatively, you can select one or more tests from the Test Explorer (use Ctrl-Click to select multiple tests), then right-click and select “Run”.
Whenever you run fewer than all the tests, the tests that were not run
are dimmed in the Test Explorer to indicate that these results are not
up to date. Be sure you always finish by running all the tests to make sure they all pass on the same version of your code.
Each CIS 300 lab assignment that uses unit testing is set up to use GitHub’s auto-grading feature, so that whenever the assignment is pushed, the server will run the unit tests. The overall result of the tests is indicated by an icon on the line below the “<> Code” button on the repository’s web page (you may need to refresh the page to show the latest commit). A brown dot indicates that the tests have not yet completed (this usually take a couple of minutes). A green check mark indicates that all tests have passed. A red X indicates that at least one test has failed, or that the tests couldn’t be run.
Unit testing will not be done by the GitHub server on any homework assignments in CIS 300. Instead, the auto-grading feature is used for a different purpose - to record push times. Thus, each push will result in an indication that all tests have passed, even if the code doesn’t compile.
You may receive emails indicating the results of auto-grading. You can control this behavior as follows:
- On any GitHub page, click on the icon in the upper-right corner and select “Settings”.
- On the navigation pane on the left, click “Notifications”.
- Scroll down to the “System” section, and select your desired notification behavior under “Actions”.
Using Multiple Machines
Using Multiple Machines
Source control provides one way to access your code from multiple machines. Before you decide to do this, however, you should consider whether this is the best approach. For example, if you have a CS Account
, you have a network file system (the U: drive on CS Windows systems) that you can use whenever you have internet access. From off campus, you need to tunnel into campus using a Virtual Private Network, or VPN (see the KSU Information Technology Services page on Virtual Private Networking
for instructions). Once on campus, you can mount this file system as a network drive by following the instructions on the CS support page, “DiskUsage
”.
As an alternative to the U: drive or some cloud service, you can use your GitHub repositories to store a master copy of each assignment, and clone local copies as needed on the different machines you use. Once you have code in a GitHub repository, you can clone that repository to a local machine as described in “Git Repositories
”. When you are finished working on that machine, commit all changes and push them to GitHub. If at some later point you need to resume working on a machine whose Git repository is out of date, you can update it by clicking the down-arrow icon in the Visual Studio “Git Changes” tab.
If you are careful about pushing all changes to GitHub and updating each local copy whenever you begin working on it, everything should go smoothly. Problems can occur, however, if you have made changes to a local version that is out of date, then either try to update it by pulling the GitHub copy, or try to push these changes to GitHub. In such cases, the following message will be shown:
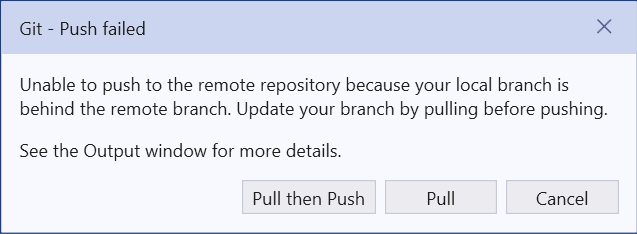
At this point, you should click the “Pull then Push” button in the above message. This usually won’t fix the problem, as indicated by an error message at the top of the “Git Changes” tab. In order to resolve the conflicts in the two versions, look in the “Unmerged Changes” section of the “Git Changes” tab. This will list the files that are different in the two versions. To resolve the conflicts in a file, right-click on it, and select “Merge…”. Visual Studio will then show the two versions of the file side by side with the conflicts highlighted. If you want the version you are currently trying to push, simply click the “Take Current” button at the top. Otherwise, you can select individual portions from the two versions - the result will be shown below the two versions. When you are satisfied with the result, click the “Accept Merge” button. Once you have merged all conflicting files, you will then need to commit and push again.
Checkpointing
Checkpointing
Sometimes when writing code, we see that we have gone down a wrong path and would like to undo some major changes we have made. Source control can help us with this if we checkpoint by committing our changes from time to time, using commit messages that clearly describe the changes made in that commit. (Note that it is not necessary to push these commits to GitHub until you are ready to submit the assignment.) Git’s revert feature allows us to undo any of these commits.
Before you access Git’s revert feature, you should undo any uncommitted changes. To do this, go to the “Git Changes” tab, right-click on the first line under “Changes”, and select “Undo Changes”. You will be asked to confirm this action. This will undo any changes to that folder. If you have more folders containing changes, repeat this process for each changed folder.
To access Git’s revert feature, select “View Branch History” from the “Git” menu. This will reveal a list of all the commits for this local Git repository, with the most recent commit listed at the top. To undo all of the changes in any commit, right-click on that commit, and select “Revert” from the popup menu. The result is automatically committed.
Warning
You should always revert commits starting with the most recent and working backwards (i.e., from the top of the list toward the bottom). Otherwise, you will probably encounter conflicts that need to be resolved, as described in the previous section
. You may even reach a state in which no commits can be reverted.